INTRODUCTION TO LINEAR PROGRAMMING.
This section covers Review of Inequalities, Bounded and Unbounded Regions, Inequality Word Problem, Linear Programming Terms, and Linear Programming Word Problems.
Linear Programming sounds really difficult, but it’s just a neat way to use math to find out the best way to do things – for example, how many things to make or buy. It usually involves a system of linear inequalities, called constraints, but in the end, we want to either maximize something (like profit) or minimize something (like cost). Whatever we’re maximizing or minimizing is called the objective function.
Linear programming was developed during the second World War for solving military logistic problems. It is used extensively today in business to minimize costs and maximize profits.
Before we start Linear Programming, let’s review Graphing Linear Inequalities with Two Variables.
To graph inequalities on the coordinate system, we need to get “y” by itself on the left hand side, so it’s best to use the slope-intercept or “ ”
formula. This is because we’ll easily know which way to shade the
graph, and we’ll make fewer errors doing this. The shaded areas will be
where the equation “works”; in other words, where the solutions are.
”
formula. This is because we’ll easily know which way to shade the
graph, and we’ll make fewer errors doing this. The shaded areas will be
where the equation “works”; in other words, where the solutions are.
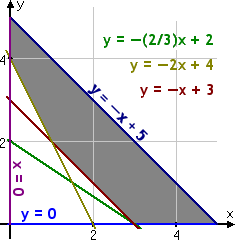
When we have “y < ”, we always shade in under the line that we draw (or to the left, if we have a vertical line). So think of “less than” as “raining down” from the graph.
When we have “y > ”, we always shade above the line that we draw (or to the right, if we have a vertical line). So think of “greater than” as “raining up” from the graph. (I know – it doesn’t really “rain up”, but I still like to explain the graphs that way.)
Note that you can always plug in an (x, y) ordered pair to see if it shows up in the shaded areas (which means it’s a solution), or the unshaded areas (which means it’s not a solution.) For an example of this, see the first inequality below.
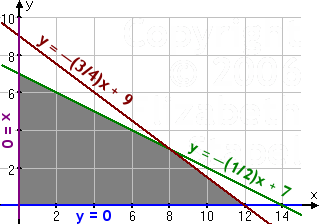
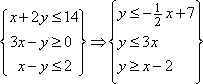
With “<” and “>” inequalities, we draw a dashed (or dotted) line to indicate that we’re not including that line (but everything up to it), whereas with “ ” and “
 ”, we draw a regular line, to indicate that we are including it in the solution. To remember this, I think about the fact that “<” and “>” have less pencil marks than “” and “”,
so there is less pencil used when you draw the lines on the graph. You
can also remember this by thinking the line under the “” and “” means you draw a solid line on the graph.
”, we draw a regular line, to indicate that we are including it in the solution. To remember this, I think about the fact that “<” and “>” have less pencil marks than “” and “”,
so there is less pencil used when you draw the lines on the graph. You
can also remember this by thinking the line under the “” and “” means you draw a solid line on the graph.
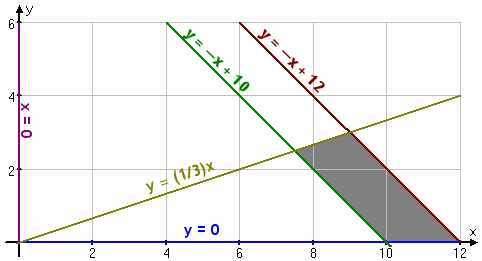
Note that the last example is a “Compound Inequality” since it involves more than one inequality. The solution set is the ordered pairs that satisfy both inequalities; it is indicated by the darker shading.
Here are some examples:

You’ll just put the first variable on the x axis and the second on the y axis. We will be solving for the number of each type that either gives the maximum profit, or minimum cost.

Let’s first see an example of just graphing an inequality in a real-life situation:
Lisa has an online jewelry shop where she sells earrings and necklaces. She sells earrings for $30 and necklaces for $40. To make a profit, she must sell at least $1200 of jewelry per month.
Define the variables, write an inequality for this situation, and graph the solutions to the inequality.
It’s best to make the first item (pairs of earrings) the x, and the second item (necklaces) y. (Usually we can look at what the problem is asking to get these variables). So let’s plug in some real numbers to try to get our equations. If she sells 1 pair of earrings and 1 necklace, she’ll only make $70, which is way below her goal for a profit. How about 20 pairs of earrings and 15 necklaces? Do you see what we’re doing here? The number of pairs of earrings she sells times $30 plus the number of necklaces she sells times $40 has to be greater than $1200.
Also, she can’t sell less than 0 pairs of earrings or necklaces, so we need to include those inequalities, too.
So here are the inequalities, and we’ll also draw a graph:

Typically, we will be solving for the number of each type that either gives the maximum profit, or minimum cost. The maximum profit or minimum cost expression is called the objective function. We’ll do an example where we want to maximize profit, so our objective function will be “Maximize 30x + 40y”.
The inequalities of the problem are called the constraints, since we are limiting what we have, such as time or resources. We’ll do an example where we are limiting our time to make jewelry. We also will always have our non-negative constraints, where the x and y values have to be greater than or equal to 0. Some constraints will involve greater than inequalities, for example, if a certain number of things need to be sold. Usually there will be a sentence or phrase in the word problem for each constraint.
We have to make sure our inequality is bounded, in order to find a maximum profit (for minimizing cost, it doesn’t have to be bounded, but it usually is). Again, the bounded region (solutions to the system of inequalities) is called the feasible region, which will be the double-shaded region..
After we graph the inequalities, we’ll want to find the corner points. The corner points are the vertices of the feasible region, which are the intersections of the lines of the feasible region. The solution to the linear programming will occur at one of the corner points. (There is something called a Corner Point Theorem that proves this, but we won’t have to worry about it).
Then we’ll substitute our corner points into the objective function to see which point yields the largest (for maximizing profit) or smallest (for minimizing cost) value. We can do this with a table, as we’ll see later.
Define the variables, write an inequality for this situation, and graph the solutions to the inequality.
Objective Function: Since we are maximizing profit, this will be a maximum, and it will be total dollars. So the objective function is Maximize 15x + 20y.
Constraints: Lisa’s constraints are based on her time, and also her materials. Always make sure all the units match; we had to change 30 minutes into .5 hours. Also note that we didn’t need to know what the jewelry sells for; sometimes they will give you extra information!
Let’s set up a separate constraint for each sentence, and first put it in a table:

Let’s turn these into inequalities, and also add the non-negative constraints:

Corner Points: Think of the corner points as on the outside of the shaded area, but where there is a turn in the graph (the vertices). In this case, we can easily see what they are from the graph; if we can’t, we’ll have to solve a system of equations (see next example).
Then take these points and plug in the x and y values into the objective function. Here is what we get:
 So, in order to maximize her profits, Lisa should make 10 pair of earrings and 5 necklaces per week, and her weekly profit is $250.

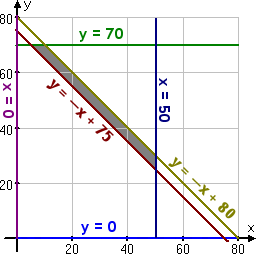
Bountiful Boats has to produce at least 5000 cabin cruisers and 12,000 pontoons each year; they can produce at most 30,000 jet skis in a year. The company has two factories: one in Michigan, and one in Wisconsin; each factory is open for a maximum of 240 days per year. The Michigan factory makes 20 cabin cruisers, 40 pontoons, and 60 jet skis per day. The Wisconsin factory makes 10 cruisers, 30 pontoons, and 50 jet skis per day. The cost to run the Michigan factory per day is $960,000; the cost to run the Wisconsin factory per day is $750,000. How many days of the year should each factory run in order to meet the boat production, yet do so at a minimum cost?
Objective Function: Since we are minimizing cost per day, this will be a minimum, and it will be total dollars. So the objective function is Minimize 960000x + 750000y.
Constraints: Bountiful Boats’ constraints are based on how much they need to produce (both less than and greater than inequalities), how many days the factories are open (less than inequality), along with the non-negative constraints.
If you can’t find the constraints from sentences in the problem, we can look for another set of items (like cabin cruisers, pontoons, and jet skis), and these will usually each represent an inequality. Let’s set up a separate constraint for each of the boats, and put them in a table. Note that the first two inequalities are less than (“at least”), and the last one is greater than (“at most”).
 Let’s turn these into inequalities, and also add the factory days
open and non-negative constraints. Notice how we use compound
inequalities for the number of days open.
Let’s turn these into inequalities, and also add the factory days
open and non-negative constraints. Notice how we use compound
inequalities for the number of days open.
 Corner Points:
Think of the corner points as on the outside of the shaded area, but
where there is a turn in the graph (the vertices). In this case, we can
easily see what they are from the graph; if we can’t, we’ll have to
solve a system of equations.
Corner Points:
Think of the corner points as on the outside of the shaded area, but
where there is a turn in the graph (the vertices). In this case, we can
easily see what they are from the graph; if we can’t, we’ll have to
solve a system of equations.
Let’s say we couldn’t see the exact intersection of from the graph. We could turn the equations into equalities, and use Linear Combination of Systems to solve:
 Then take these points and plug in the x and y values into the objective function. Here is what we get:
 Note that you can see that the point (240, 240) won’t provide a
minimum since the point (240, 80) will provide a smaller amount. So,
technically, you wouldn’t even have to plug this point into the
objective function.
Note that you can see that the point (240, 240) won’t provide a
minimum since the point (240, 80) will provide a smaller amount. So,
technically, you wouldn’t even have to plug this point into the
objective function.
So, in order to minimize their costs, Bountiful Boats should make boats 240 days a year at their Michigan plant, and 80 days a year at their Wisconsin plant. This will yield a cost of $290,400,000. So you can see that your answer may be surprising!
Learn these rules, and practice, practice, practice!
On to Rational Functions and Equations – you are ready!
Linear Programming sounds really difficult, but it’s just a neat way to use math to find out the best way to do things – for example, how many things to make or buy. It usually involves a system of linear inequalities, called constraints, but in the end, we want to either maximize something (like profit) or minimize something (like cost). Whatever we’re maximizing or minimizing is called the objective function.
Linear programming was developed during the second World War for solving military logistic problems. It is used extensively today in business to minimize costs and maximize profits.
Before we start Linear Programming, let’s review Graphing Linear Inequalities with Two Variables.
Review of Inequalities
Let’s go back and revisit graphing linear inequalities on the coordinate system.To graph inequalities on the coordinate system, we need to get “y” by itself on the left hand side, so it’s best to use the slope-intercept or “
When we have “y < ”, we always shade in under the line that we draw (or to the left, if we have a vertical line). So think of “less than” as “raining down” from the graph.
When we have “y > ”, we always shade above the line that we draw (or to the right, if we have a vertical line). So think of “greater than” as “raining up” from the graph. (I know – it doesn’t really “rain up”, but I still like to explain the graphs that way.)
Note that you can always plug in an (x, y) ordered pair to see if it shows up in the shaded areas (which means it’s a solution), or the unshaded areas (which means it’s not a solution.) For an example of this, see the first inequality below.
With “<” and “>” inequalities, we draw a dashed (or dotted) line to indicate that we’re not including that line (but everything up to it), whereas with “
Note that the last example is a “Compound Inequality” since it involves more than one inequality. The solution set is the ordered pairs that satisfy both inequalities; it is indicated by the darker shading.
Here are some examples:
Again, note that the last example is a “Compound Inequality” since it involves more than one inequality. The solution set is the ordered pairs that satisfy both inequalities; it is indicated by the darker shading.
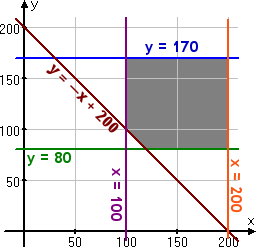
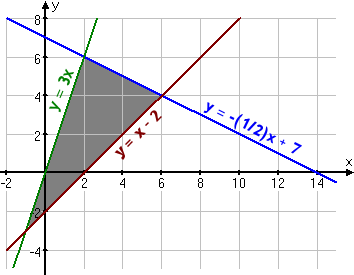
Bounded and Unbounded Regions
With our Linear Programming examples, we’ll have a set of compound inequalities, and they will be bounded inequalities, meaning the inequalities will have both maximum and minimum values. (We’ll show examples below, but think of bounded meaning that you could draw a “circle” around the feasible region, which is the solution set to the inequalities).
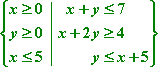
Here are what some typical Systems of Linear Inequalities might look like in Linear Programming:
Inequality Word Problem:
Linear Programming problems are typically word problems – not cool. But most will fit in the same mold: for these beginning problems, they will have two types of unknowns or variables, like earrings and necklaces, and they will involve inequalities.You’ll just put the first variable on the x axis and the second on the y axis. We will be solving for the number of each type that either gives the maximum profit, or minimum cost.
Let’s first see an example of just graphing an inequality in a real-life situation:
Lisa has an online jewelry shop where she sells earrings and necklaces. She sells earrings for $30 and necklaces for $40. To make a profit, she must sell at least $1200 of jewelry per month.
Define the variables, write an inequality for this situation, and graph the solutions to the inequality.
It’s best to make the first item (pairs of earrings) the x, and the second item (necklaces) y. (Usually we can look at what the problem is asking to get these variables). So let’s plug in some real numbers to try to get our equations. If she sells 1 pair of earrings and 1 necklace, she’ll only make $70, which is way below her goal for a profit. How about 20 pairs of earrings and 15 necklaces? Do you see what we’re doing here? The number of pairs of earrings she sells times $30 plus the number of necklaces she sells times $40 has to be greater than $1200.
Also, she can’t sell less than 0 pairs of earrings or necklaces, so we need to include those inequalities, too.
So here are the inequalities, and we’ll also draw a graph:
Linear Programming Terms
Again, the linear programming problems we’ll be working with have the first variable on the x axis and the second on the y axis. In our example, x is the number of pairs of earrings and y is the number of necklaces. Typically you can look at what the problem is asking to determine what the variables are.Typically, we will be solving for the number of each type that either gives the maximum profit, or minimum cost. The maximum profit or minimum cost expression is called the objective function. We’ll do an example where we want to maximize profit, so our objective function will be “Maximize 30x + 40y”.
The inequalities of the problem are called the constraints, since we are limiting what we have, such as time or resources. We’ll do an example where we are limiting our time to make jewelry. We also will always have our non-negative constraints, where the x and y values have to be greater than or equal to 0. Some constraints will involve greater than inequalities, for example, if a certain number of things need to be sold. Usually there will be a sentence or phrase in the word problem for each constraint.
We have to make sure our inequality is bounded, in order to find a maximum profit (for minimizing cost, it doesn’t have to be bounded, but it usually is). Again, the bounded region (solutions to the system of inequalities) is called the feasible region, which will be the double-shaded region..
After we graph the inequalities, we’ll want to find the corner points. The corner points are the vertices of the feasible region, which are the intersections of the lines of the feasible region. The solution to the linear programming will occur at one of the corner points. (There is something called a Corner Point Theorem that proves this, but we won’t have to worry about it).
Then we’ll substitute our corner points into the objective function to see which point yields the largest (for maximizing profit) or smallest (for minimizing cost) value. We can do this with a table, as we’ll see later.
Linear Programming Word Problems
Now let’s put it all together and solve “real” linear programming problems!Problem:
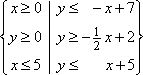
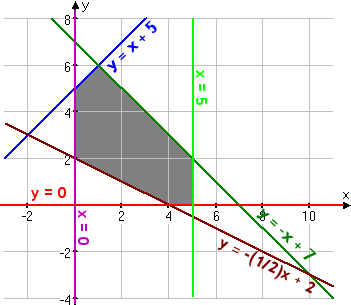
Lisa has an online jewelry shop where she sells earrings and necklaces. She sells earrings for $30 and necklaces for $40. It takes 30 minutes to make a pair of earrings and 1 hour to make a necklace, and, since Lisa is a math tutor, she only has 10 hours a week to make jewelry. In addition, she only has enough materials to make 15 total jewelry items per week. She makes a profit of $15 on each pair of earrings and $20 on each necklace. How many pairs of earrings and necklaces should Lisa make each week in order to maximize her profit, assuming she sells all her jewelry?Define the variables, write an inequality for this situation, and graph the solutions to the inequality.
Solution:
Variables: Let’s look at what the problem is asking: how many pairs of earrings and how many necklaces should Lisa make to make a profit? So let’s let x = the number of pairs of earrings, and y = the number of necklaces.Objective Function: Since we are maximizing profit, this will be a maximum, and it will be total dollars. So the objective function is Maximize 15x + 20y.
Constraints: Lisa’s constraints are based on her time, and also her materials. Always make sure all the units match; we had to change 30 minutes into .5 hours. Also note that we didn’t need to know what the jewelry sells for; sometimes they will give you extra information!
Let’s set up a separate constraint for each sentence, and first put it in a table:
Let’s turn these into inequalities, and also add the non-negative constraints:
Corner Points: Think of the corner points as on the outside of the shaded area, but where there is a turn in the graph (the vertices). In this case, we can easily see what they are from the graph; if we can’t, we’ll have to solve a system of equations (see next example).
Then take these points and plug in the x and y values into the objective function. Here is what we get:
Problem:
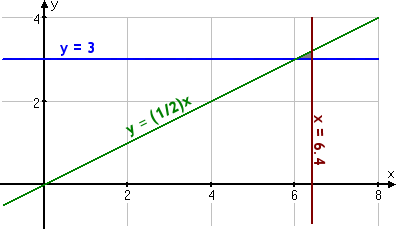
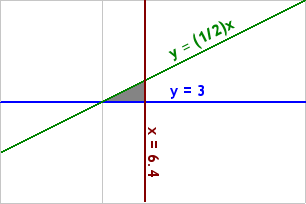
Bountiful Boats has to produce at least 5000 cabin cruisers and 12,000 pontoons each year; they can produce at most 30,000 jet skis in a year. The company has two factories: one in Michigan, and one in Wisconsin; each factory is open for a maximum of 240 days per year. The Michigan factory makes 20 cabin cruisers, 40 pontoons, and 60 jet skis per day. The Wisconsin factory makes 10 cruisers, 30 pontoons, and 50 jet skis per day. The cost to run the Michigan factory per day is $960,000; the cost to run the Wisconsin factory per day is $750,000. How many days of the year should each factory run in order to meet the boat production, yet do so at a minimum cost?
Solution:
Variables: Let’s look at what the problem is asking: how many days of the year should each factory run? So let’s let x = the number days per year that the Michigan factory should run, and y = the number days per year that the Wisconsin factory should run.Objective Function: Since we are minimizing cost per day, this will be a minimum, and it will be total dollars. So the objective function is Minimize 960000x + 750000y.
Constraints: Bountiful Boats’ constraints are based on how much they need to produce (both less than and greater than inequalities), how many days the factories are open (less than inequality), along with the non-negative constraints.
If you can’t find the constraints from sentences in the problem, we can look for another set of items (like cabin cruisers, pontoons, and jet skis), and these will usually each represent an inequality. Let’s set up a separate constraint for each of the boats, and put them in a table. Note that the first two inequalities are less than (“at least”), and the last one is greater than (“at most”).
Let’s say we couldn’t see the exact intersection of
So, in order to minimize their costs, Bountiful Boats should make boats 240 days a year at their Michigan plant, and 80 days a year at their Wisconsin plant. This will yield a cost of $290,400,000. So you can see that your answer may be surprising!
Learn these rules, and practice, practice, practice!
On to Rational Functions and Equations – you are ready!